7 Key LMS Reports to Measure Training Impact
Learning management systems (LMSs) help organizations with their online learning and development efforts. But without comprehensive reporting features, companies have no real way of knowing if they’re on the right track.
LMS reports play a critical role in evaluating training program effectiveness, learner progress, course completion rates, and other essential metrics.
Some key types of LMS reports are for enrollment, course progress, surveys, or training materials, among others.
In this article, we’ll be taking a look at what LMS reports are, how they work, what they’re good for, and how to interpret and analyze them.
What are LMS reports?
LMS reports are a set of LMS tools used to collect and analyze key LMS metrics.
Whether it’s for employee training and onboarding, customer education, sales enablement, or compliance training, LMS reporting tools can help decision-makers and other stakeholders keep a watchful eye on training programs.
Depending on the LMS reporting capabilities, stakeholders can track progress and see how well learners go through specific courses.
LMS reports can also help determine how well your content is performing or how well employees manage to retain knowledge after completing a course.
You can also evaluate the learning experience and how well users interact with the training course modules.
By keeping track of key performance indicators (KPIs) and other relevant metrics, you’ll stay on top of the process, and determine what works and what doesn’t, as well as make the necessary adjustments based on your findings.
You can use LMS reports to keep upper management, investors, the board of directors, and other stakeholders informed about the state of your corporate training and how your efforts are translating into actual results.
You also don’t need to have special know-how or be some sort of a genius statistician to make sense of all the numbers.
The best LMS solutions structure the information gathered into logical and easy-to-understand report templates.
There are plenty of benefits of using LMS reports as part of your learning and development strategy. Let’s explore some of them.
What are the benefits of LMS reporting?
People often dread making reports. They can be tedious, time-consuming, and are often complicated to put together.
But if done right and if they’re automated, LMS reports can bring numerous benefits to the table.
Let’s go through each of these in more detail.
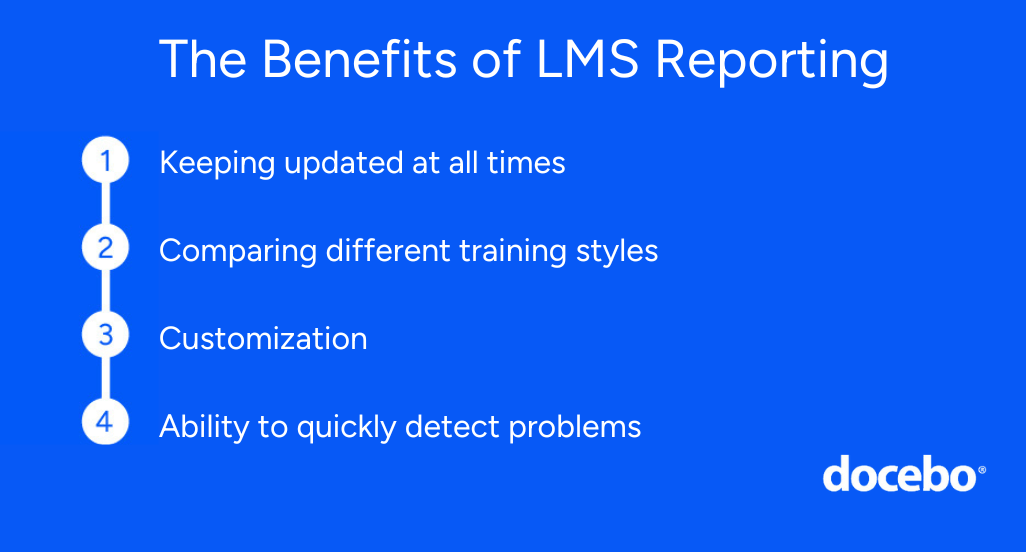
Benefit #1: Keeping updated at all times
Many see monthly reports as just a useless and time-consuming chore, but they do serve a purpose.
That said, monthly reports don’t give real-time visibility into what’s going on at any given time.
Modern online learning platforms store all sorts of useful information about learners, content, and training programs that administrators can access whenever they want or need.
Admins or other relevant stakeholders can generate useful reports at any time, gaining access to relevant data at any stage of the learning process.
Benefit #2: Comparing different training styles
Another benefit of LMS reporting is that companies can run different e-learning and corporate training programs and compare.
Say, for example, an organization is running in-person instructor-led training alongside self-paced blended learning.
With LMS reporting features, they can track training-course KPIs and determine which program generates better results.
Benefit #3: Customizing
Most LMS reporting features also allow for a high degree of customization.
This means users can pick and choose what specific data to track and in which timeframes.
By doing so, they can dig deeper into various aspects of their L&D programs.
It also makes for better and more informed decisions about various aspects of the e-learning program and business as a whole.
Benefit #4: Detecting problems quickly
Given all the other benefits, LMS reports allow administrators and other stakeholders to quickly and easily detect any trouble areas or bottlenecks that might exist throughout the e-learning process.
Instead of having to wait for the end of the month or sift through mounds of data manually, admins can generate custom reports at every stage of the training cycle.
This allows them to fix any issues before they can become large enough to affect the rest of the organization.
Whether you’re in the market for an LMS or are looking to migrate to a new system, you should make sure that it includes all the reporting capabilities you need.
Below are seven such LMS report types to help you with your e-learning initiatives.
7 types of LMS reports to help with online training
Reporting is among the most important LMS requirements.
Without robust reporting capabilities, companies are operating blind, never really knowing the effectiveness of their L&D efforts.
There are seven main types of LMS reports that help organizations with their online learning and training activities.
With a training platform like Docebo Learn LMS, you will be able to generate any of these reports on demand and use Docebo Learn Data to break up your organization’s data silos.
By combining all key learning metrics with your other business KPIs from your LMS-integrated tech stack, you’ll get a broader perspective on your entire business strategy.
That said, let’s take a look at seven of the most effective types of LMS reports.
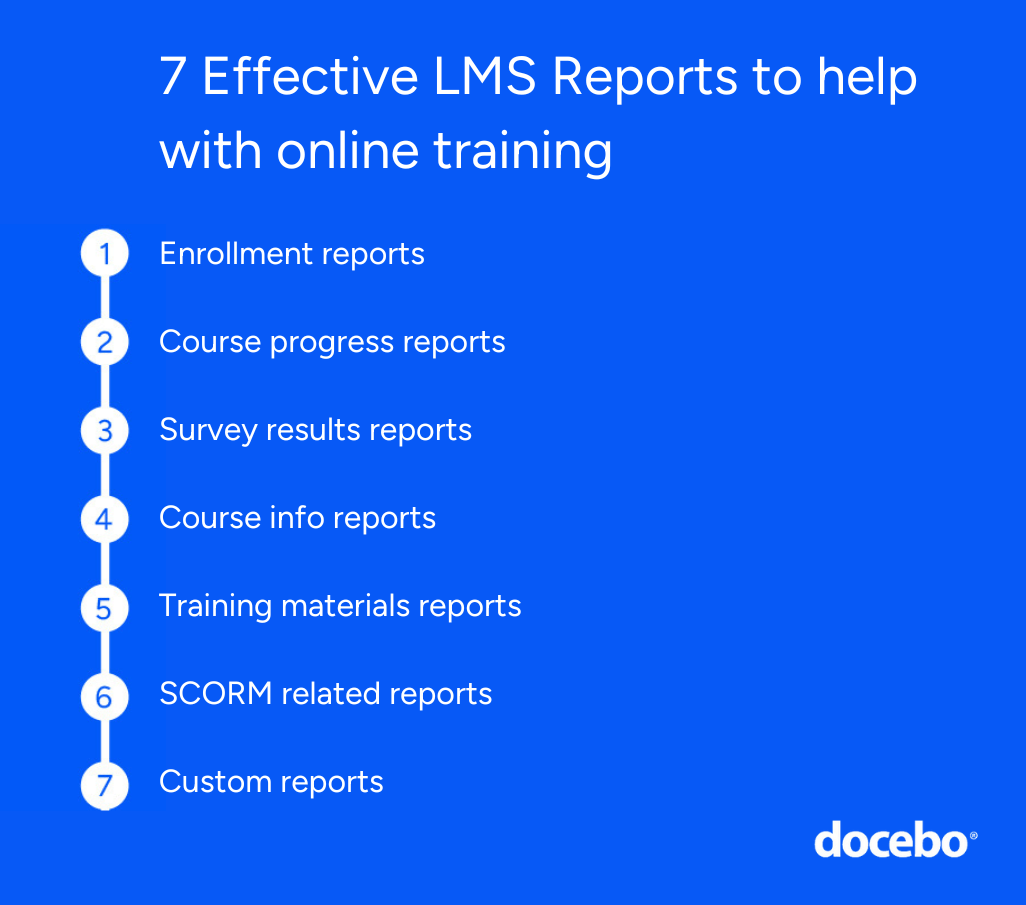
1. Enrollment reports
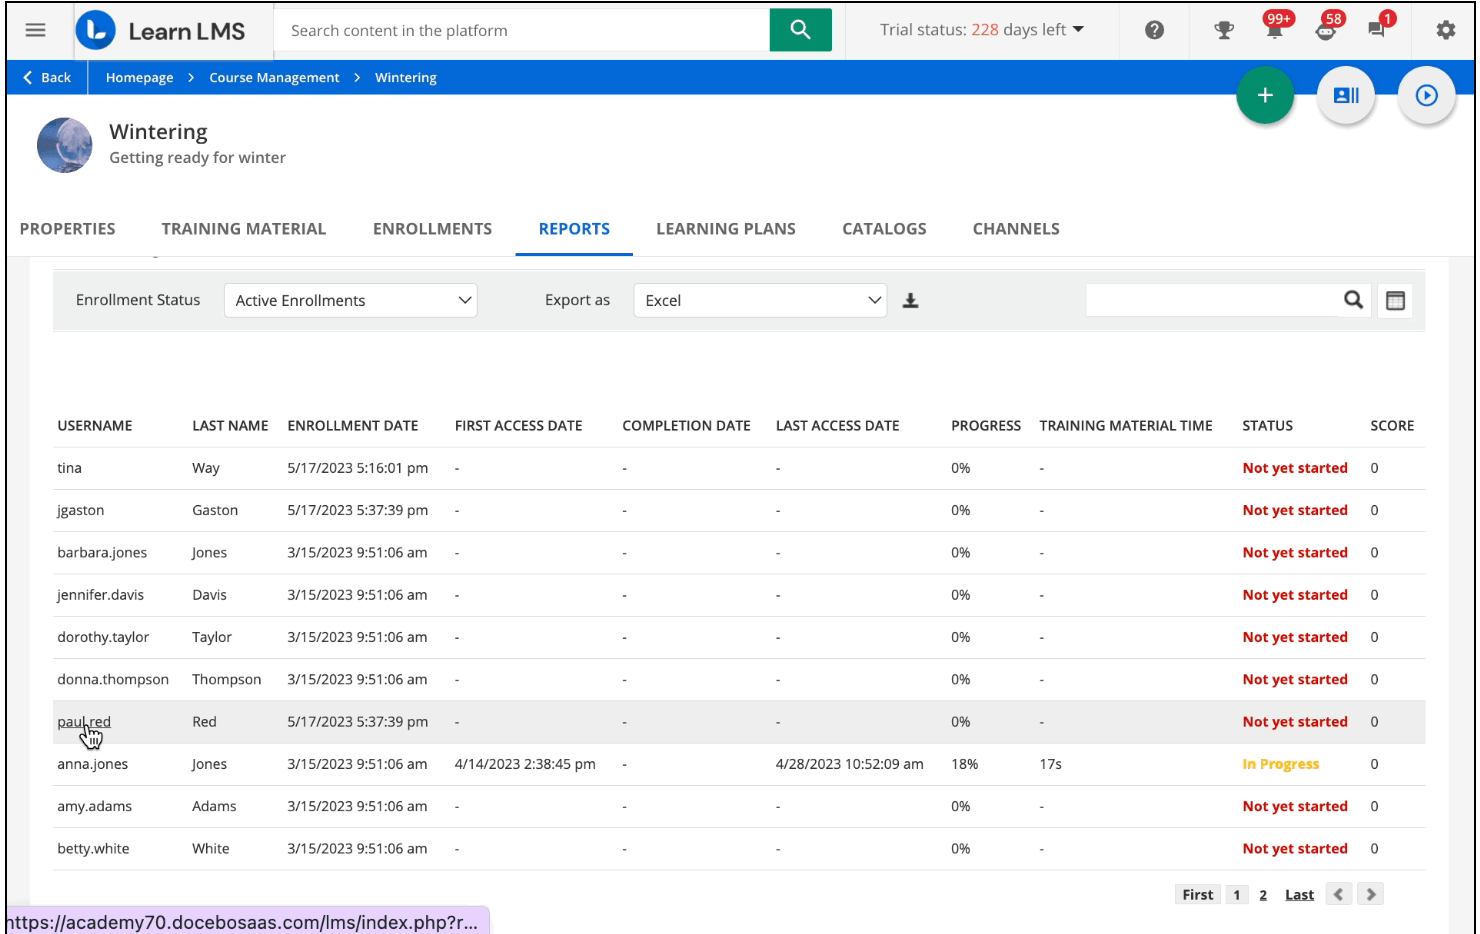
These types of reports are among the main types of LMS reporting functionalities as they include detailed information about user enrollment activities.
They include data in terms of training course enrollment numbers, start dates, learner progress, session times, scores, and completion status on both active and archived enrollments.
Learners, administrators, and instructors stand to benefit from LMS enrollment reports.
They include key insights into individual and group learning pathways by tracking learner progress and participation in various training courses.
Enrollment reports help determine the overall effectiveness of e-learning programs.
Learners can also use this information to track their progress and review their course enrollment history, making sure they are progressing correctly through the training program.
2. Course progress reports
As with the enrollment reports, you can use Docebo LMS to generate course progress reports.
This type of report highlights how learners are progressing through their courses and how far along each one of them is.
It also shows the total amount of time spent on each module as well as the user’s current status, such as Not Yet Started, In Progress, or Completed.
Course progress reports are particularly useful for trainers, HR, and L&D teams.
For example, instructors can check if and where learners encounter challenges throughout a course or drop out. This way, they can immediately offer additional support and guide the learner toward course completion.
Additionally, HR teams can use this report for mandatory training before an audit. This way, they ensure that everyone has their compliance training done and certifications in order, and will not incur any legal or financial penalties.
3. Survey results reports
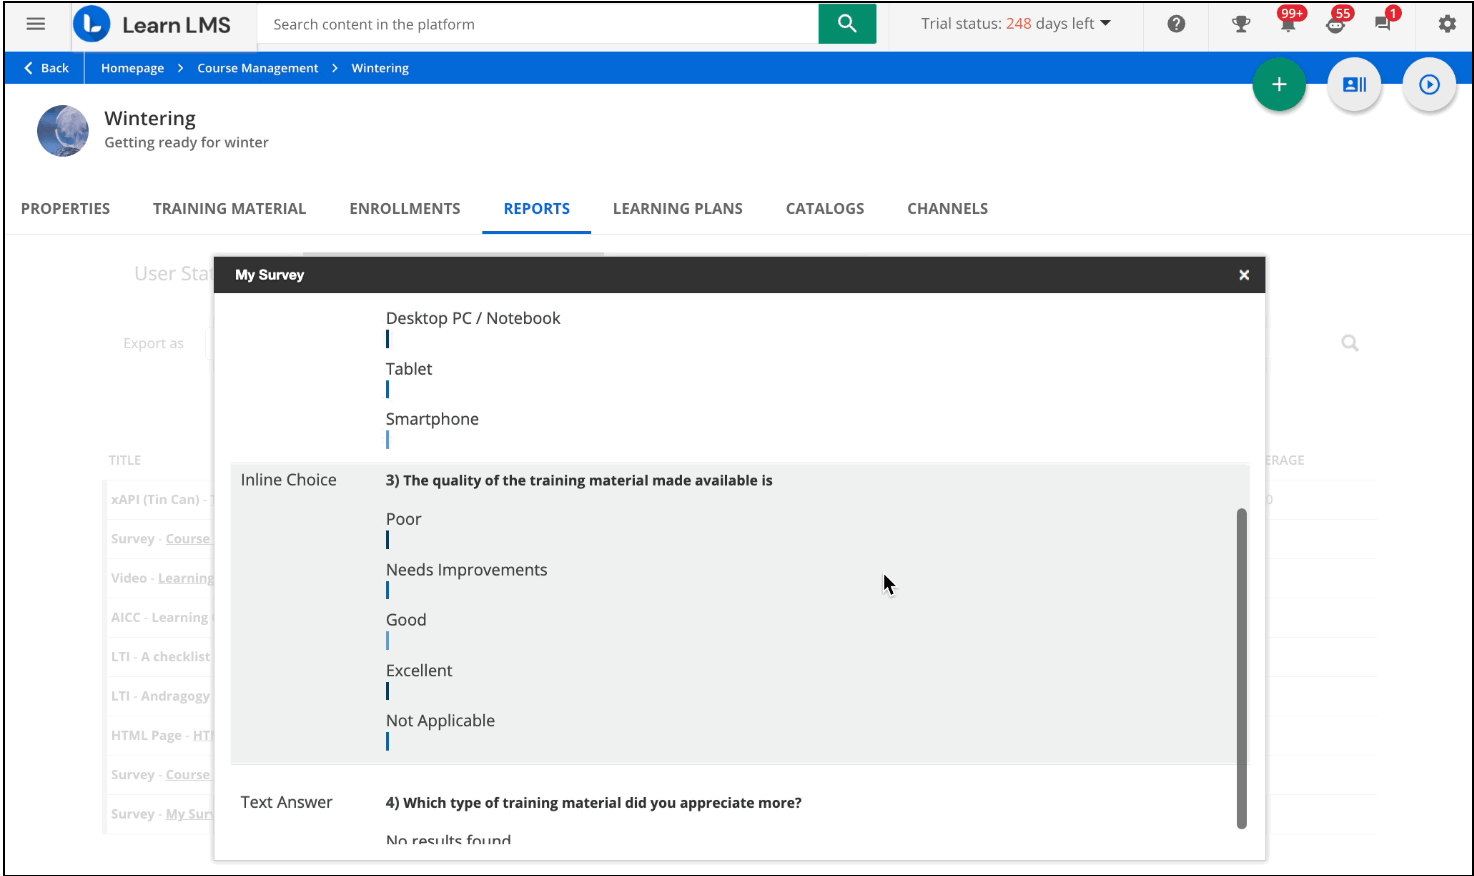
Learner surveys play a critical role in gauging the effectiveness of a learning and development strategy.
They allow companies to gather feedback, providing useful insights for identifying trends and spotting emerging issues before they have a chance to turn into bigger problems.
Training modules can be too difficult or not engaging enough, resulting in long course completions, lower knowledge retention, or even dropouts.
With Docebo Learning Evaluation, you can generate and assign surveys to your e-learning courses as part of the completion process.
You’ll know how users answered those questions anonymously and compare them with global benchmarks of over five million surveys in Docebo’s database.
You can attach surveys at the start of a course to get an idea of people’s needs and expectations. Similarly, you can include surveys throughout the course or upon completion to get specific feedback.
Although it’s to be expected that learners will respond differently to these questions, you can compile the data and identify trends.
If, for example, a large number of users say that various modules are not engaging enough, you can include gamification features to boost the learning experience.
These survey results reports can also highlight areas or modules where learners need more clarification or where a more personalized approach may be required.
As long as you don’t overdo it to the point of survey fatigue, these reports can help drive learner engagement and satisfaction, enhance training processes, and improve retention rates.
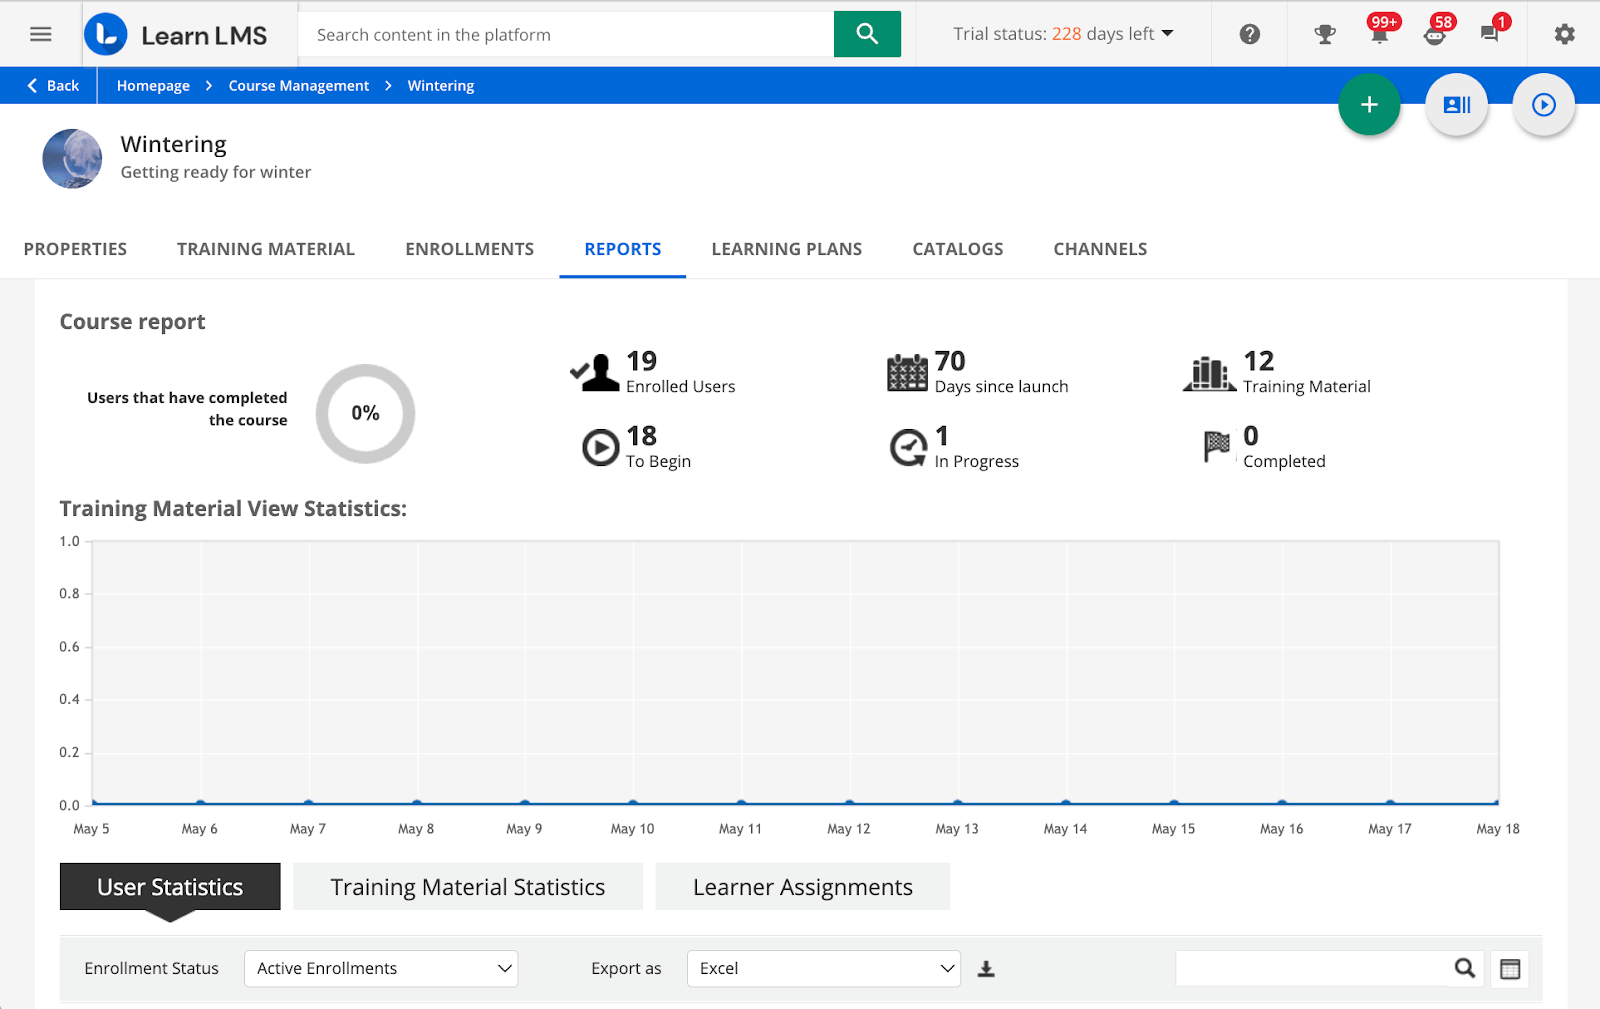
4. Course info reports
These course info reports provide a general overview of specific e-learning courses.
They include information such as the total number of enrollments, how many users are at each stage of the process (i.e., in progress, yet to begin, or completed), the number of days since launch, and the number of training materials in the course.
You can use this data to determine how well learners are progressing through the courses on average and how they manage at every stage of the process.
Administrators will also get a better idea about the popularity of certain training programs that meet learner needs and requirements.
Similarly, they’ll be in a better position to determine the demand for each specific course or module and allocate the appropriate instructors or materials to them.
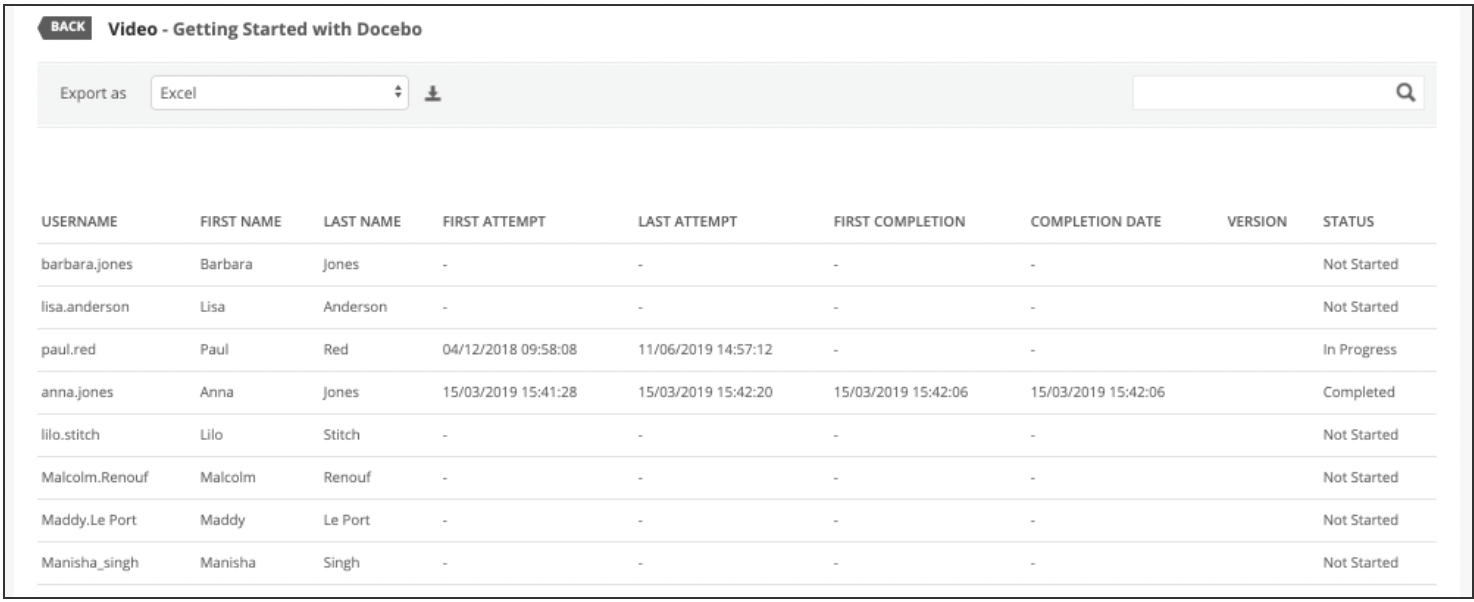
5. Training materials reports
This particular LMS report lists all the training materials included in a course.
You can search for specific materials or export them via CSV or Excel and include useful information such as the number of users at various stages of the completion process for each training material.
Depending on the type of learning material, you’ll get access to user information.
If applicable, the report also highlights the average score for each training material. For example, e-learning materials with generally low scores should raise some red flags.
It could mean the course module is too complicated or it’s not engaging enough and learners lose their attention. In this case, it’s best to take a second look and improve it.
Alternatively, if the users’ scores are overwhelmingly positive, it could mean that the course material isn’t challenging learner competencies enough and may require more complex quizzes.
Regardless of the situation, training materials reports help ensure a balanced and consistent learning experience across the entire user base.
6. SCORM related reports
SCORM reports highlight how learners progress through SCORM-related courses.
SCORM stands for Sharable Content Object Reference Model and is an e-learning industry standard that ensures compatibility between online training content systems.
Such content includes more interactive elements such as quizzes, gamification features, and assessments.
A SCORM-compliant LMS, for instance, can play SCORM content designed in a similarly compliant content-authoring tool.
These types of reports help trainers and administrators analyze the results of individual learners based on the answers to the quizzes or assessments in the course material.
They show the questions included in the SCORM course, the answers provided by the learner, and which of those answers were correct or incorrect. You can also gain access to advanced analytics by extrapolating data about user activity.
7. Custom reports
Users can also create customized reports whenever they find that standardized versions don’t dig deep enough into key areas they’re interested in.
Docebo Learn LMS’s analytics feature allows for plenty of reports and dashboard customization across a wide array of variables such as groups, individual learners, certifications, learning paths, and more.
For example, admins can create User-Courses reports used to thoroughly analyze the activities users perform when undergoing courses specifically designed for them.
Administrators can keep all stakeholders informed about the learning activity progress happening in the organization. They can also use the data to improve learner performance and personalize courses to fit the specific needs and skills of individual learners.
Other types of customizable reports include:
- Groups/Branches – Courses highlight training progress for each course based on learner groups or branches.
- Users – Learning Plans showcase individual learner progress for each learning plan.
- Users – ILT Sessions indicate progress details for individual users for each instructor-led training session.
- Users – Certifications detail learner data for every obtained certification.
- Users – External Training lists all users associated with external training activities.
- E-commerce – Transactions detail all e-commerce transactions taking place on the LMS.
While this list is not exhaustive, it highlights the possibilities of what can be tracked, measured, and analyzed with customizable reports.
Let’s now turn our attention to how best to interpret data generated from LMS reports.
How to interpret LMS Reports
LMS reports can provide plenty of benefits and are an invaluable tool for organizations and their L&D strategies.
However, without knowing how to interpret them correctly, they can become nothing more than a nuisance people must deal with on a regular basis.
Here are four useful steps on how to best interpret this data and get the best possible outputs from your LMS reports.
Understand the report’s purpose
In business, every action needs to have a purpose and it’s no different when it comes to LMS reports.
Those statistics and other information will have little to no significance if you generate reports for their own sake.
You’ll often need a starting point to know what you’re looking for.
For example, you can look at key customer onboarding metrics such as churn rates or time-to-productivity.
If you’re underperforming in this area, it could also mean that your sales enablement plan is not as optimized as it could be.
Your sales reps may not have sufficient product knowledge, don’t know how to interact with clients very well, or don’t have access to the right sales enablement content.
When you know what you’re looking for, LMS reports can highlight troubled areas and guide you to where you need to make improvements.
Carefully analyze your data
E-learning data analytics represent a treasure trove of information if you know how to “read between the lines.”
It’s not so much about the numbers themselves, as about the trends, patterns, and correlations between different data points.
Say, for instance, you’re launching a new employee onboarding program with gamification features like leaderboards, badges, and other rewards.
You’re not only more likely to see better course engagement rates because of it, but you’ll also be able to identify your top learners based on their rankings in multiple categories.
Compare the data
When you’re looking to improve your processes, it’s always good to have something to compare to.
As we’ve mentioned previously, you can use Docebo Learn LMS to collect tons of analytics data in a centralized location. Docebo Learn Data then organizes and combines it with your business intelligence (BI) tool to help you analyze the impact of your learning programs.
With Docebo Learning Impact you can also compare learner feedback based on millions of surveys from similar companies in your industry. These can help you reach conclusions otherwise not easily visible from your data alone.
Make informed decisions and take action based on the data
With all this actionable information clearly laid out in front of you, you can make data-backed decisions that will improve your corporate training strategy.
You’ll be constantly on top of the situation, knowing what works, what doesn’t, why, and what you need to change to streamline and optimize your processes.
L&D teams can also pass this information along to higher management, shareholders, board members, and other decision-makers to highlight the benefits and ROI of their online training initiatives.
Although there is a slight learning curve when it comes to effectively managing and integrating LMS reports, it’s not something that can’t be mastered with a bit of practice and a few best practices to go along.
What are some best practices for analyzing LMS reports?
Learning to use LMS reports to improve and optimize the company’s e-learning efforts is the first step.
Businesses should also include the following best practices to get the best possible results.
Build custom reports
As mentioned previously, custom reports can dig deeper and often yield more detailed information than standardized LMS reports.
Before using them, however, admins and other stakeholders should still know the purpose of those reports and what they’ll be used for.
It’s no use building customized reports if the information generated adds very little value to the decision-making process.
Introduce automation into the mix
It’s generally good practice to automate as much of the reporting process as possible.
Admins can schedule LMS reports at regular intervals or after specific events, such as when a new user joins or completes a course.
This way, everyone gets the same learning experience, while companies have a steady stream of actionable data to analyze and work with to improve processes.
Use infographics
Infographics are a simple yet effective way of summarizing complex data into a visually appealing, easy-to-read, and understandable format.
Many enterprise LMSs have the functionality to synthesize complex data in such a way that makes it easy, even for the uninitiated, to make sense of the information and draw the right conclusions from what’s being presented.
With Docebo, for example, you can turn both internal and external sources of information into bite-sized and visually appealing snippets of information. It also uses AI, reducing hours-long processes to only minutes.
It’s now up to you to include LMS reporting in your daily processes and make the best use of their capabilities.
Conclusion
LMS reports can bring numerous benefits to the table and have the potential to turn your L&D efforts completely around.
They allow for better and more informed decision-making, offering a bird’s-eye view over the entire e-learning process.
When integrated with your other technologies, an LMS with robust reporting capabilities can break data silos and get a unified view of the entire organizational strategy.
Schedule a demo with Docebo today and see how its reports can optimize your e-learning initiatives.